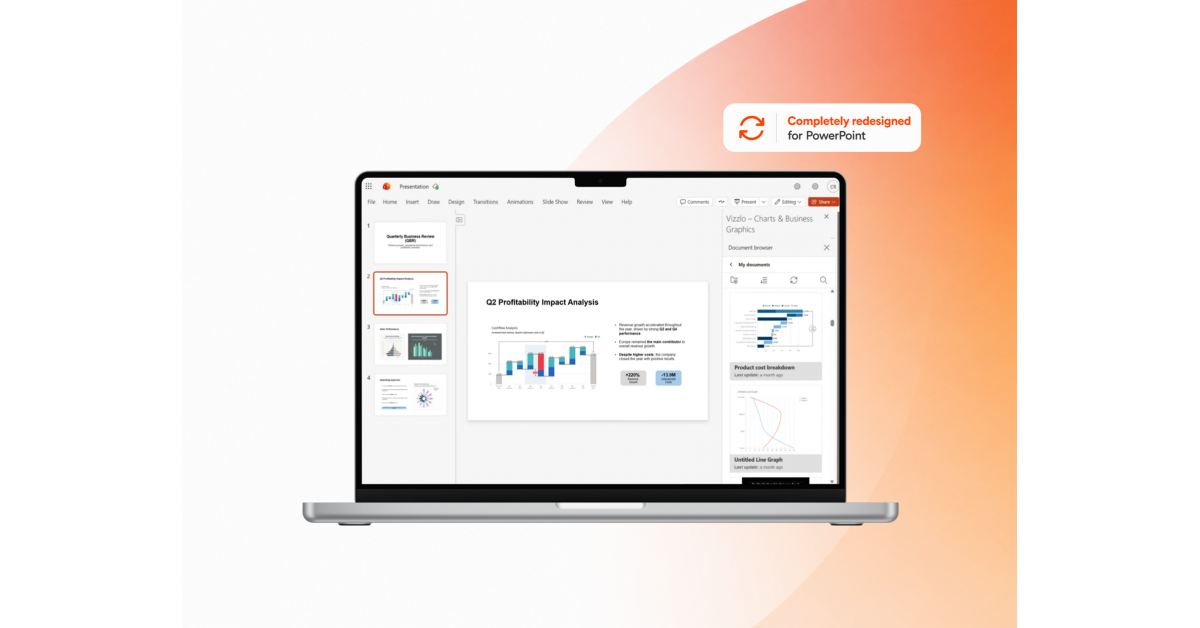
Vizzlo has introduced a fully overhauled version of its Microsoft PowerPoint integration, extending the enhanced functionality to PowerPoint for the web and Mac.
“Through this overhaul, we have incorporated all the insights gained from our Windows and Google Slides integrations to deliver one cohesive PowerPoint experience.”— Rob Lillack, CEO & Co-founder, Vizzlo
Vizzlo announced the launch of a thoroughly updated version of its Microsoft PowerPoint integration, expanding the streamlined charting capabilities—previously exclusive to its native Windows tool—to PowerPoint for the web and PowerPoint for Mac. This update provides a quicker, more instinctive, and uniform method for designing, placing, and refreshing professional charts without ever exiting PowerPoint.
For an extended period, Vizzlo’s native Windows integration has enabled professionals to build presentation-ready charts directly inside PowerPoint. At the same time, hundreds of thousands of users have turned to Vizzlo for Google Slides, offering critical knowledge about how contemporary teams craft presentations, collaborate on materials, and ensure charts stay current as data and messaging shift.
Those lessons have now been applied back to the Microsoft platform. The revamped integration offers a cohesive experience across PowerPoint for Windows, PowerPoint for the web, and PowerPoint for Mac, making chart creation and management feel like an inherent component of working within PowerPoint.
“Our native Windows integration has provided a smooth PowerPoint experience for years,” stated Rob Lillack, CEO and co-founder of Vizzlo. “With this redesign, we have consolidated everything we learned from that work and our Google Slides integration into PowerPoint on Windows, the web, and Mac. Users can now enjoy the same straightforward workflow no matter where they build their presentations.”
The redesigned interface mirrors how modern teams operate in practice. As data fluctuates, input arrives, and slides evolve, charts must adapt as well. The new process simplifies generating fresh charts, integrating existing ones, and keeping presentations up to date without interrupting the flow of creating a presentation.
Every element of the interface has been polished, from the overhauled sidebar to more seamless chart updates and deeper integration with PowerPoint. Although many improvements are subtle, they collectively make working with charts considerably faster, simpler, and more instinctive.
Vizzlo provides PowerPoint users with access to over 120 professionally designed chart types, such as Waterfall, Marimekko, Gantt, Timeline, Sankey, Mekko, Radar, Organizational Charts, and many more. Each chart is fully customizable and tailored for business presentations, consulting decks, executive reports, sales pitches, and strategy updates.
The updated integration works across PowerPoint for Windows, PowerPoint for the web, and PowerPoint for Mac, delivering a uniform experience while leveraging the unique strengths of each platform. Wherever users create presentations, Vizzlo fits naturally into their workflow.
Availability
The updated Vizzlo PowerPoint Add-in is now accessible via the Microsoft Marketplace.
To begin:
Launch Microsoft PowerPoint.
Navigate to Home → Add-ins (or Insert → Get Add-ins, depending on your version).
Search for Vizzlo in the Microsoft Marketplace.
Select Add to install the add-in.
Log in with your Vizzlo account and start creating, inserting, and updating professional charts directly within your presentation.
About Vizzlo
Vizzlo assists professionals in crafting presentation-ready business charts in just minutes. Featuring over 120 customizable chart types and integrations for Microsoft PowerPoint and Google Slides, Vizzlo enables consultants, analysts, marketers, and business teams to communicate data clearly and professionally without leaving their presentation software.
Camilo Rada
Vizzlo GmbH
marketing@vizzlo.com
Visit us on social media:
LinkedIn
Bluesky
Instagram
Facebook
YouTube